Ranks and Ratings Blog
Ranks and Ratings- Slicing and Dicing Schedules and Results Since 2002

Advertisement
© Copyright 2009-13, Paul Kislanko.
January 27, 2013
I noted last time that the recent trend toward a more connected schedule continues this year - with another schedule or two 57.7 percent of all team-pairs will be either opponents or opponents' opponents by the end of the regular season. We are benefitting from a continuing increase in the amount of inter-regional play, as seen from the following table.
Each cell contains the number of road games for teams from the region that identifies the row against teans from regions identified by the column heading (plus neutral site games for which the row-region is the home team.)
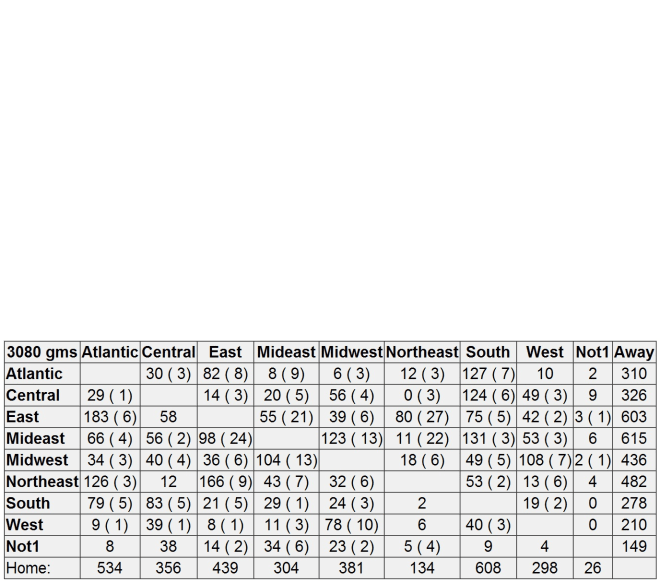
Although nearly three quarters of all interconference games are between teams from different regions, all those Atlantic-Central-South or East-Northeast-Mideast games don't contribute nearly so much as the West-not West games. However, about 57 percent of Western teams' non-conference games are against teams from other regions, and that is a Good Thing.
Follow this link for the same counts for all interconference pairs.
Talk about Rankings and Ratings in The Dugout or the
January 19, 2013
There are 298 teams in Division 1 this year, and D1Baseball.com has the schedules for 295 of them so far, so we can do some preliminary analysis. It looks like a pretty fun year!
Some random facts about the schedule:
The latest opening game is Yale's (vs Army in Tampa.)
The latest home-opener is North Dakota's (April 19th.
Alabama A&M will be the first team to play 10 games (their 10th is February 24th)
16 teams will have played 10 games before March 1st.
The last team to reach 10 games does so on March 29th.
298 teams means there's 44,253 team-pairs. By the end of the regular season:
57.6 percent of all team-pairs will be either opponents or opponents' opponents.
228 teams (76.5%) will have more than half the field as an opponent or opponents' opponent.
The average number of games between opponents is 2.47 with an average of 21.77 opponents/team.
(fewest is UConn's 1.70 game average and 33 opponents)
The games graph diameter will be 4, and at that distance there are 28,493.3 connections per team-pair.
2013 SOS Based upon Opponents' 2012 Ratings
It wouldn't be a D1 baseball season if Southern Cal didn't have the toughest schedule of any team in the field. For 2013 that's true even if you take the opponents' 2012 RPI values as the measurement. Ordering the results by non-conference opponents' (2012) strength, here are the 25 toughest by ISR:
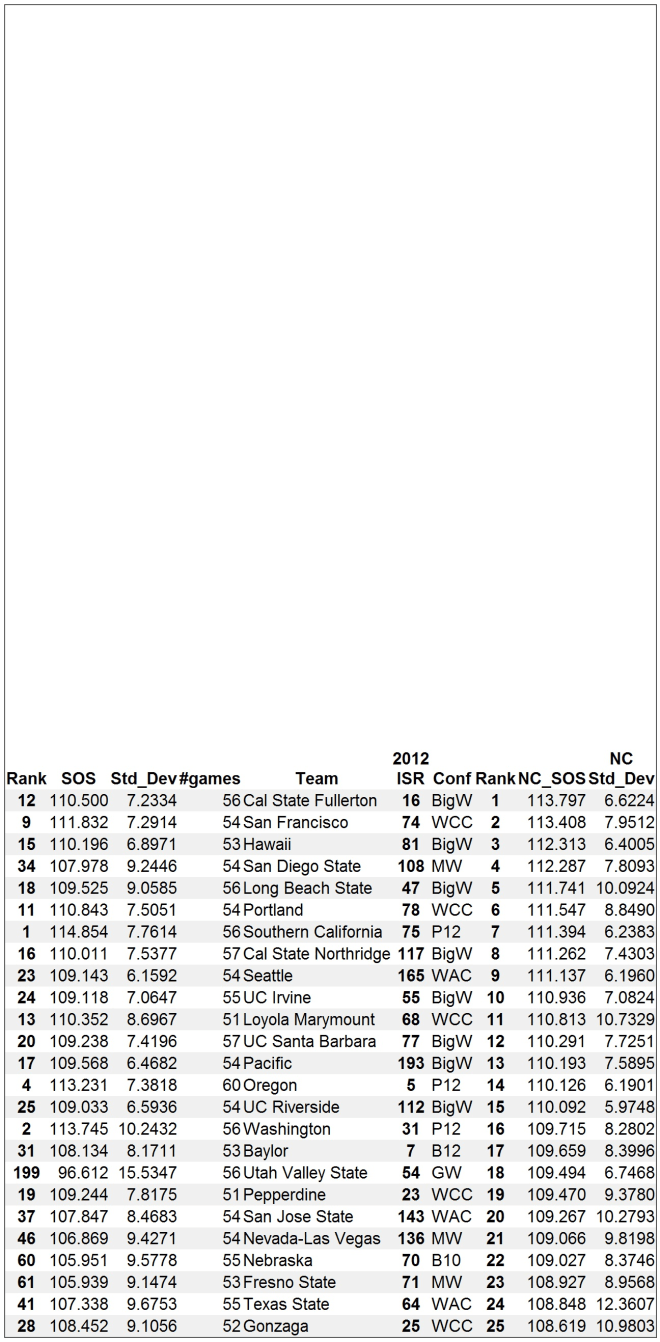
There are no real surprises in that list, but the same list using opponents' 2012 RPI values is quite interesting.
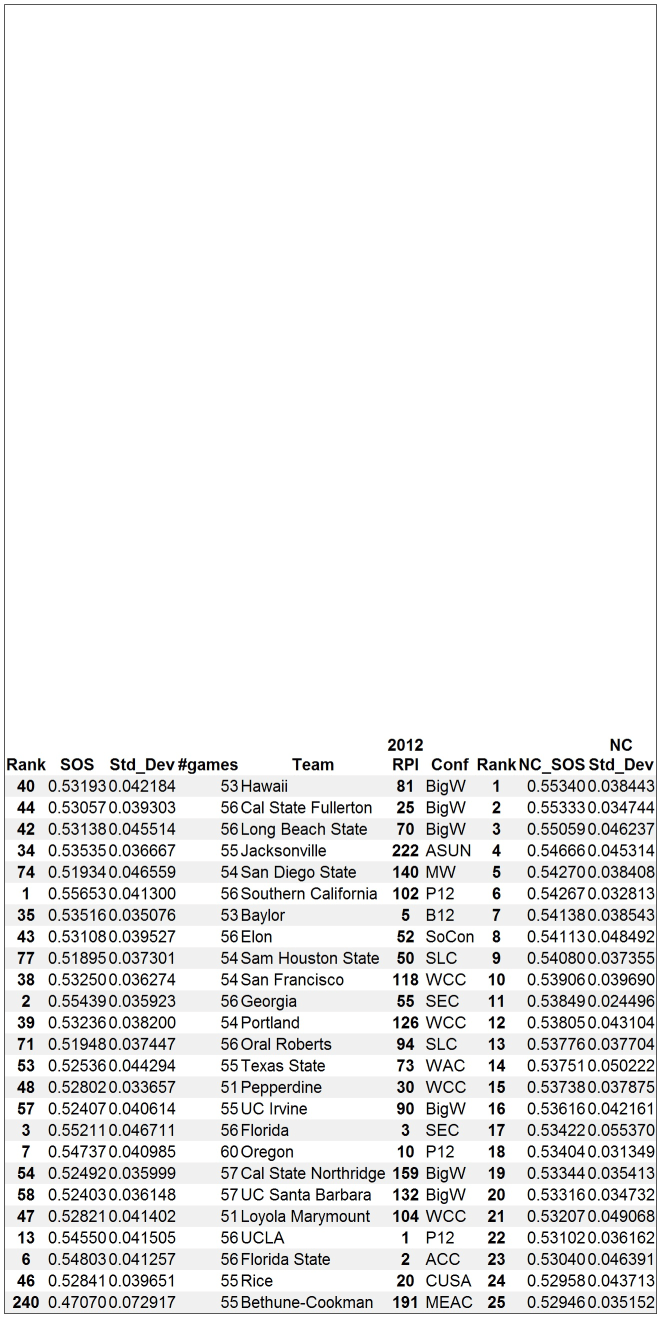
Fully 60 percent of the RPI-based list is made up of teams from the Western region. Inter-regional scheduling just may have improved enough that the RPI is a meaningful rating. Oh, wait. They're not using it anymore...
The full list (ISR) and full list (RPI) include all teams as well as counts of home and away (road or neutral site) non-conference games.
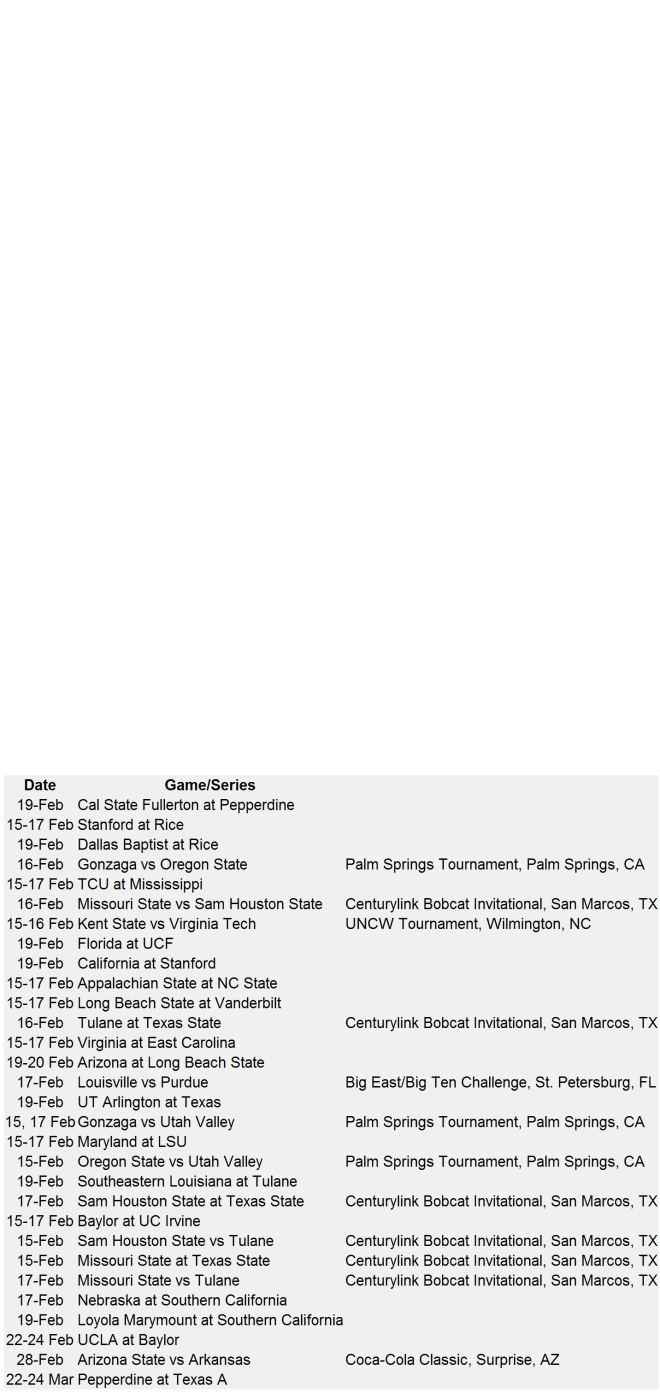
Fun Factors
Closing today with a list of some of the good interconference games (series) to look forward to. It's sorted by week and a combination of how highly and closely -ranked the opponents were in 2012.
Talk about Rankings and Ratings in The Dugout or the