Overall SOS for 2006
A little help from the neighbors
Last time we talked about "intended" schedule strength based upon non-conference schedules. The quotation marks are required because most teams also have conference games to take into account. A strong non-conference schedule is helpful for teams that have fewer conference games or whose conference opponents vary greatly in quality.
Advertisement
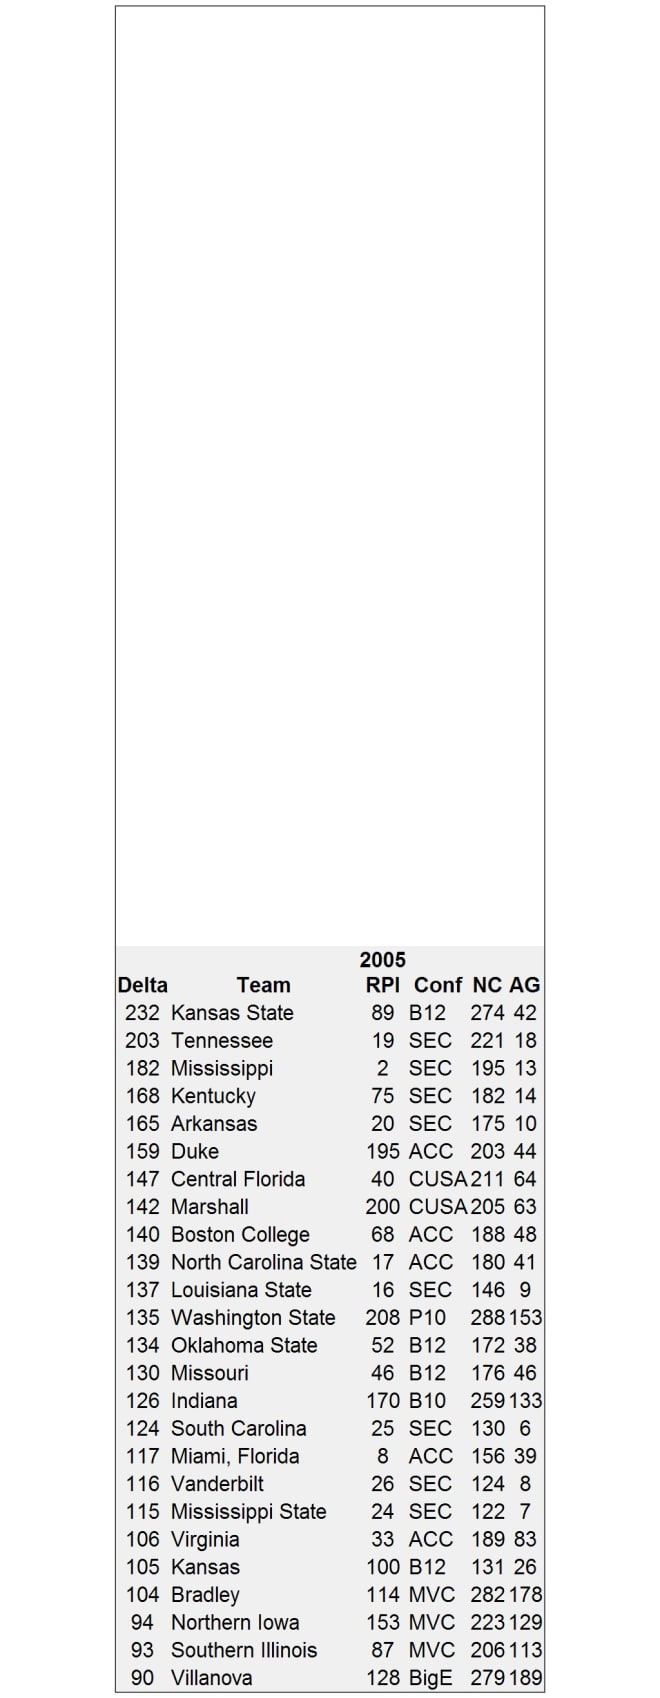
It is less important for teams in larger conferences (with more than half their games in conference play) or very competitive conferences. No matter the non-conference schedule, teams in the "Big Six" will have most of their RPI determined by conference play. So before we get to the whole list, it might be worthwhile to see who is helped or hurt the most by their conference schedule, starting with the 25 teams helped the most by their affiliation.
Not surprisingly there are eight SEC teams on the list. Except it's something of a surprise that there aren't ten.
The new CUSA is going to challenge UCF. Note they and Marshall have over 100-spot jumps in SOS between non-conference and overall SOS.
The conference schedules put a number of Big 12 and ACC teams on this list, too.
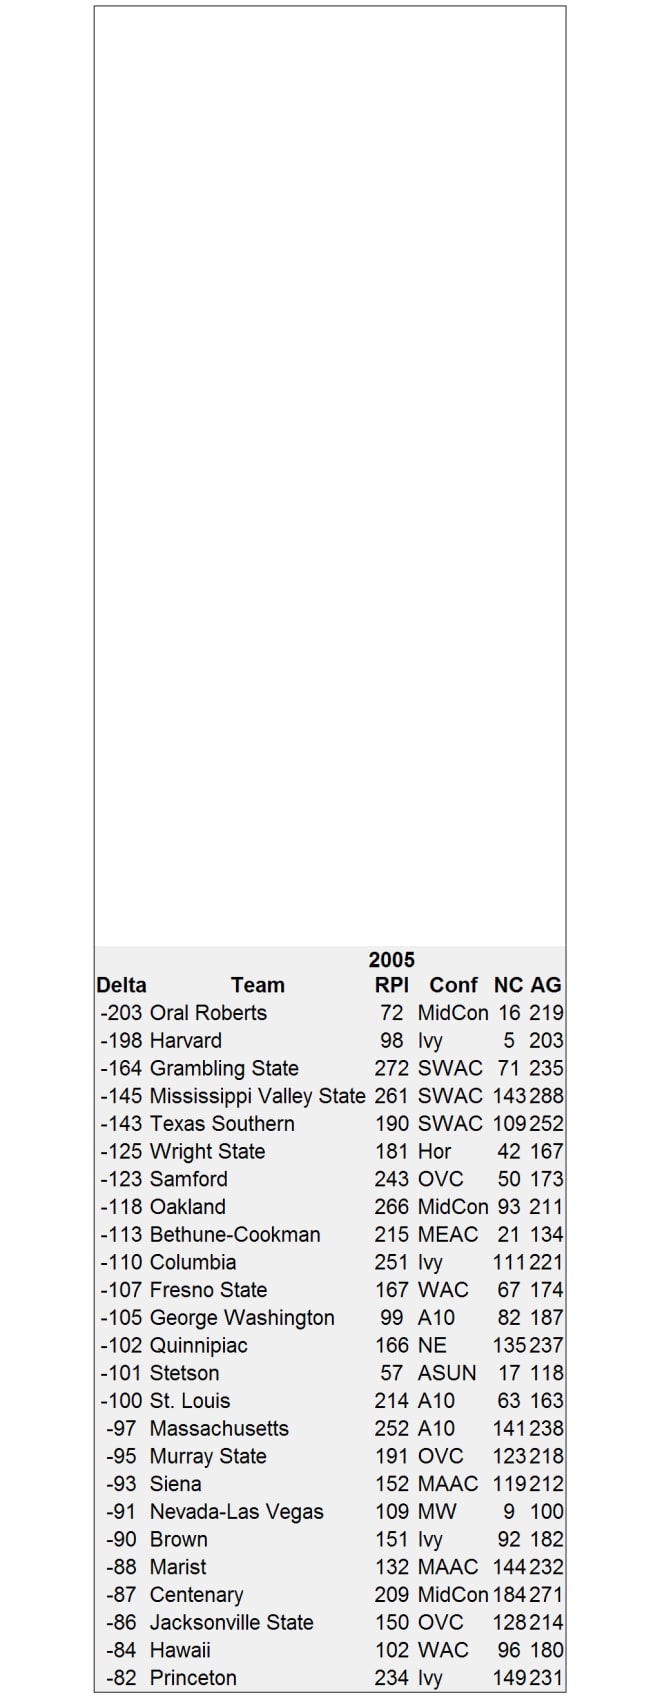
The teams whose SOS rank dropped the most aren't as easy to interpret. In some cases its not the difference in quality between the teams whose position drops and its conference mates, but that the non-conference schedule is just that much more difficult. In the case of the SWAC and Ivy league, the reason they make this list is simply that they play so few non-conference games against division one opponents. The case where the team really is that much better than its conference mates is Oral Roberts, who've won the Mid-Con every year they've been in it.
Intended Schedule Strength - 2006 (All Games)
The RPI benefits of playing in a league with few or no bad teams is evident. All but the last two of the top 50 toughest schedules are for teams in the "power conferences": SEC, Big 12, ACC, Pac 10, Big West or CUSA.
Team 2005
RPI Conf ISS Cnt Best Median Worst
1 Georgia 31 SEC -67.78 55 2 24 294
2 Florida 5 SEC -61.91 56 8 27 294
3 Alabama 23 SEC -59.98 56 2 26 261
4 Auburn 22 SEC -56.48 56 2 27 248
5 UCLA 184 P10 -52.11 56 2 32 208
6 South Carolina 25 SEC -43.98 56 2 26 218
7 Mississippi State 24 SEC -42.32 57 2 31 275
8 Vanderbilt 26 SEC -39.07 56 2 31 274
9 Louisiana State 16 SEC -37.09 56 2 26 294
10 Arkansas 20 SEC -31.21 56 2 34 294
11 Texas 1 B12 -31.07 56 3 49 176
12 Texas A&M 42 B12 -28.63 56 1 52 253
13 Mississippi 2 SEC -28.00 56 16 31 243
14 Kentucky 75 SEC -27.13 56 2 31 285
15 Oklahoma 36 B12 -22.64 56 1 49 249
16 Southern California 15 P10 -22.20 59 7 55 208
17 Baylor 4 B12 -21.79 56 1 50 294
18 Tennessee 19 SEC -21.47 57 2 31 274
19 Arizona State 11 P10 -19.89 56 1 49 221
20 Rice 18 CUSA -19.59 56 1 53 294
21 Long Beach State 29 BigW -13.93 56 1 58 186
22 Nebraska 12 B12 -12.54 56 1 49 264
23 Texas Tech 49 B12 -10.93 56 1 52 237
24 California 64 P10 -9.60 55 4 56 238
25 Cal State Fullerton 10 BigW -7.54 57 15 58 186
26 Kansas 100 B12 -3.89 62 1 46 294
27 Cal State Northridge 186 BigW -3.14 56 10 62 210
28 Georgia Tech 6 ACC -1.80 56 8 63 294
29 Houston 60 CUSA -0.41 56 1 55 294
30 Wake Forest 73 ACC 2.49 55 5 68 246
31 Clemson 9 ACC 2.86 56 6 71 213
32 Stanford 37 P10 2.86 56 1 64 238
33 East Carolina 53 CUSA 7.59 54 3 60 226
34 Arizona 30 P10 9.91 55 7 64 250
35 Maryland 139 ACC 15.79 56 6 68 288
36 Memphis 222 CUSA 19.25 56 2 65 275
37 Virginia Tech 120 ACC 20.14 57 6 73 254
38 Oklahoma State 52 B12 20.63 56 1 70 281
39 Miami, Florida 8 ACC 21.71 55 5 73 294
40 North Carolina 14 ACC 22.11 56 6 80 248
41 North Carolina State 17 ACC 23.32 57 6 73 254
42 Kansas State 89 B12 25.61 56 1 52 294
43 Southern Mississippi 38 CUSA 30.59 56 2 76 267
44 Duke 195 ACC 31.73 59 6 73 288
45 Tulane 3 CUSA 35.38 56 1 72 294
46 Missouri 46 B12 35.60 57 1 82 294
47 Alabama-Birmingham 90 CUSA 40.77 56 3 76 294
48 Boston College 68 ACC 47.00 47 6 92 276
49 South Florida 63 BigE 49.07 56 5 83 294
50 Charleston Southern 110 BigS 49.80 56 12 91 237
51 UC Riverside 96 BigW 50.47 55 10 105 186
52 San Diego 137 WCC 51.11 56 1 100 193
53 UC Irvine 55 BigW 51.84 58 10 101 238
54 Illinois State 145 MVC 52.32 56 12 88 294
55 South Alabama 61 SBC 52.91 57 3 85 284
56 Florida State 27 ACC 55.18 57 5 107 294
57 UC Santa Barbara 101 BigW 55.49 55 10 96 294
58 Pacific 117 BigW 59.30 56 4 101 238
59 Loyola Marymount 105 WCC 60.45 56 10 102 193
60 Birmingham-Southern 76 BigS 60.82 56 21 91 290
61 Florida International 66 SBC 64.54 56 8 92 265
62 Elon 81 SoCon 67.75 56 9 108 248
63 Marshall 200 CUSA 68.32 56 3 90 259
64 Central Florida 40 CUSA 69.61 56 3 90 294
65 College of Charleston 13 SoCon 70.00 56 9 108 248
66 Northwestern 161 B10 70.72 57 32 107 294
67 Texas-Pan American 176 Ind 73.39 49 1 104 294
68 Iowa 121 B10 74.75 57 12 107 285
69 Wichita State 35 MVC 75.38 64 12 100 294
70 Louisiana-Lafayette 43 SBC 76.19 47 42 107 203
71 UC Davis 130 BigW 76.24 58 7 101 285
72 Missouri State 88 MVC 76.58 55 20 107 253
73 The Citadel 141 SoCon 76.91 56 12 108 268
74 San Diego State 174 MW 77.08 60 10 109 286
75 Coastal Carolina 21 BigS 77.24 59 6 108 294
76 Texas-Arlington 112 SLC 77.25 61 1 102 294
77 North Carolina-Greensboro 79 SoCon 77.86 57 5 108 253
78 Stephen F. Austin 294 SLC 78.18 56 3 112 205
79 Notre Dame 54 BigE 82.09 56 12 106 294
80 North Carolina-Asheville 237 BigS 82.52 60 19 110 276
81 Michigan State 157 B10 83.21 56 8 107 294
82 Texas-San Antonio 136 SLC 83.34 59 1 104 294
83 Virginia 33 ACC 84.14 57 6 116 288
84 Louisiana-Monroe 172 SLC 85.48 56 16 112 294
85 Cal Poly 58 BigW 85.59 56 7 117 210
86 Illinois 82 B10 86.45 56 42 115 294
87 New Mexico 207 MW 87.05 55 7 109 286
88 Texas State 95 SLC 88.18 57 1 119 294
89 High Point 179 BigS 88.71 56 13 110 237
90 Southeastern Louisiana 138 SLC 89.05 56 2 119 294
91 Texas Christian 34 MW 89.48 56 3 109 294
92 Furman 108 SoCon 90.13 55 9 118 278
93 Winthrop 28 BigS 90.51 59 8 111 246
94 Minnesota 107 B10 92.45 56 12 121 294
95 Florida Atlantic 41 ASUN 92.91 55 19 113 294
96 Michigan 50 B10 93.02 56 4 115 266
97 Pepperdine 32 WCC 93.11 56 3 129 210
98 Purdue 80 B10 94.88 56 14 121 287
99 Oregon State 7 P10 94.92 53 11 125 273
100 Nevada-Las Vegas 109 MW 97.20 56 1 125 286
101 Kent State 111 MAC 100.25 55 23 115 294
102 Portland 193 WCC 100.33 52 7 129 285
103 McNeese State 162 SLC 100.73 55 3 119 294
104 Nicholls State 194 SLC 101.67 55 2 119 294
105 Evansville 86 MVC 102.75 57 28 121 294
106 Ohio State 59 B10 103.07 56 5 121 266
107 Georgia Southern 48 SoCon 103.53 57 6 118 294
108 North Florida 294 ASUN 104.46 56 5 127 294
109 George Mason 70 CAA 105.33 54 13 118 278
110 Penn State 122 B10 106.05 59 3 121 294
111 Eastern Michigan 196 MAC 106.61 54 19 115 294
112 Washington 62 P10 106.76 62 7 129 294
113 Southern Illinois 87 MVC 107.93 57 35 119 285
114 Wofford 213 SoCon 108.30 56 9 124 254
115 Louisville 69 BigE 108.46 57 8 128 246
116 Kennesaw State 294 ASUN 108.79 52 6 123 294
117 Appalachian State 248 SoCon 111.09 57 13 124 283
118 Stetson 57 ASUN 113.57 56 5 131 294
119 Campbell 127 ASUN 114.63 56 14 123 294
120 St. John's 47 BigE 115.40 55 12 128 289
121 Rutgers 74 BigE 116.38 56 6 128 289
122 Western Carolina 71 SoCon 116.79 56 6 124 294
123 Santa Clara 129 WCC 117.16 56 32 134 294
124 Pittsburgh 83 BigE 117.91 56 21 128 294
125 Louisiana Tech 203 WAC 122.59 56 4 134 281
126 Jacksonville 113 ASUN 124.33 54 27 133 294
127 Connecticut 106 BigE 124.44 59 41 131 294
128 Dallas Baptist 84 Ind 124.61 59 1 136 294
129 Northern Iowa 153 MVC 126.14 57 12 131 294
130 Ball State 78 MAC 126.32 57 26 135 268
131 Lamar 67 SLC 126.32 56 18 138 294
132 Mercer 123 ASUN 127.05 56 5 133 294
133 Indiana 170 B10 127.16 63 8 126 294
134 Bethune-Cookman 215 MEAC 127.17 54 5 123 294
135 Troy 65 SBC 128.25 56 22 140 294
136 Northern Illinois 221 MAC 128.39 57 11 134 287
137 Gardner-Webb 147 ASUN 128.96 56 9 127 294
138 Belmont 135 ASUN 129.20 55 19 127 294
139 San Jose State 159 WAC 129.58 57 37 134 294
140 Western Kentucky 197 SBC 131.22 55 26 140 268
141 Sam Houston State 119 SLC 131.82 57 18 138 294
142 Middle Tennessee State 85 SBC 132.50 56 26 140 275
143 New Orleans 177 SBC 132.90 50 3 140 277
144 Davidson 124 SoCon 134.26 54 13 141 251
145 Northwestern State 44 SLC 139.55 55 3 136 294
146 East Tennessee State 133 ASUN 144.90 62 6 142 294
147 Indiana State 148 MVC 145.04 57 35 145 286
148 Virginia Commonwealth 97 CAA 145.95 57 6 155 279
149 Lipscomb 168 ASUN 146.12 57 23 133 294
150 San Francisco 56 WCC 147.21 56 7 144 273
151 Georgia State 118 CAA 148.48 56 6 155 274
152 Arkansas State 140 SBC 149.34 58 2 157 281
153 Washington State 208 P10 149.89 61 7 144 294
154 Cal State Sacramento 238 WAC 150.02 57 7 156 285
155 North Carolina-Wilmington 51 CAA 150.53 57 17 155 288
156 Georgetown 171 BigE 151.54 57 47 155 278
157 Creighton 39 MVC 151.74 57 12 148 286
158 Hofstra 188 CAA 151.81 57 13 155 282
159 Xavier 246 A10 152.95 60 28 148 269
160 Towson 116 CAA 153.41 56 14 155 278
161 Seton Hall 187 BigE 154.49 53 14 160 294
162 Northern Colorado 180 Ind 155.54 57 12 144 294
163 St. Louis 214 A10 156.47 58 2 149 275
164 Liberty 91 BigS 158.71 56 21 155 276
165 James Madison 182 CAA 160.95 58 9 155 258
166 Arkansas-Little Rock 205 SBC 161.04 48 39 153 294
167 Wright State 181 Hor 162.20 56 8 149 286
168 Akron 206 MAC 162.53 57 19 158 294
169 Northeastern 164 CAA 163.42 53 6 155 294
170 Old Dominion 189 CAA 164.14 56 33 155 279
171 Dartmouth 210 Ivy 165.12 43 32 152 276
172 Radford 218 BigS 165.37 54 21 165 279
173 Samford 243 OVC 168.34 56 2 150 294
174 Fresno State 167 WAC 168.77 56 32 159 294
175 Nevada 134 WAC 169.35 57 7 159 273
176 William and Mary 155 CAA 170.59 54 9 164 279
177 Cincinnati 173 BigE 170.79 56 5 171 266
178 Bradley 114 MVC 171.10 59 35 149 294
179 St. Mary's 169 WCC 171.93 55 7 159 294
180 Hawaii 102 WAC 172.50 56 15 159 294
181 Toledo 231 MAC 174.44 55 45 158 294
182 Brown 151 Ivy 175.82 44 26 165 294
183 New Mexico State 156 WAC 179.86 56 49 159 294
184 Hawaii-Hilo 247 Ind 180.76 54 35 159 294
185 Delaware 185 CAA 183.04 56 51 164 294
186 Gonzaga 144 WCC 185.13 55 7 169 294
187 George Washington 99 A10 185.34 56 14 171 257
188 West Virginia 175 BigE 191.35 60 17 171 289
189 Villanova 128 BigE 191.68 57 1 175 289
190 North Dakota State 285 Ind 192.38 55 35 169 294
191 Cleveland State 259 Hor 192.58 57 54 173 268
192 Texas A&M-Corpus Christi 104 Ind 194.06 49 11 176 294
193 Stony Brook 219 AE 196.04 55 28 177 282
194 Virginia Military 165 BigS 196.45 62 21 179 288
195 Utah 253 MW 197.38 56 34 169 286
196 Miami, Ohio 45 MAC 198.52 56 59 173 294
197 Brigham Young 125 MW 200.05 56 7 174 286
198 Wisconsin-Milwaukee 183 Hor 205.48 56 46 169 287
199 LaSalle 227 A10 206.65 55 30 185 271
200 Albany 226 AE 206.68 57 47 178 282
201 Duquesne 216 A10 209.05 56 25 171 294
202 Butler 268 Hor 209.28 54 26 181 294
203 Harvard 98 Ivy 209.77 26 5 192 271
204 North Carolina-Charlotte 126 A10 210.27 56 13 178 283
205 Richmond 211 A10 211.71 58 12 185 269
206 Western Michigan 115 MAC 213.15 55 50 196 294
207 Bowling Green State 103 MAC 213.88 57 45 191 294
208 Illinois-Chicago 149 Hor 215.33 54 2 183 287
209 Air Force 286 MW 218.88 49 34 181 294
210 Tennessee Tech 274 OVC 220.48 58 16 191 287
211 Oakland 266 MidCon 222.68 57 19 196 294
212 Siena 152 MAAC 223.22 58 19 188 289
213 Youngstown State 142 Hor 223.73 62 52 183 294
214 Jacksonville State 150 OVC 224.82 56 24 191 294
215 Central Michigan 77 MAC 225.47 57 50 196 294
216 Ohio 158 MAC 227.21 56 45 196 294
217 Buffalo 229 MAC 228.07 58 38 196 294
218 Murray State 191 OVC 228.53 55 2 198 275
219 Oral Roberts 72 MidCon 229.14 56 3 209 294
220 Southeast Missouri State 198 OVC 229.98 56 39 191 275
221 Columbia 251 Ivy 233.33 39 41 201 280
222 New York Tech 163 Ind 236.05 60 47 200 294
223 Austin Peay State 143 OVC 236.68 59 26 197 294
224 Tennessee-Martin 275 OVC 237.54 56 24 198 294
225 Wagner 239 NE 243.02 51 28 201 289
226 South Dakota State 264 Ind 243.21 53 12 202 294
227 Vermont 131 AE 243.87 55 57 210 294
228 Fordham 160 A10 244.17 60 8 211 282
229 Maryland-Baltimore County 257 AE 247.12 57 93 204 283
230 Morehead State 223 OVC 247.40 58 19 198 294
231 Princeton 234 Ivy 249.59 41 47 210 294
232 Marist 132 MAAC 249.66 50 24 204 289
233 Hartford 276 AE 250.62 55 68 217 257
234 Yale 192 Ivy 251.24 46 25 210 276
235 Grambling State 272 SWAC 252.21 47 44 203 294
236 Dayton 154 A10 252.30 56 33 211 268
237 Quinnipiac 166 NE 252.92 50 25 210 282
238 Massachusetts 252 A10 254.31 49 59 214 294
239 Longwood 254 Ind 254.82 61 17 213 289
240 Cornell 220 Ivy 255.26 42 59 210 271
241 Arkansas-Pine Bluff 281 SWAC 256.26 38 52 203 272
242 St. Joseph's 269 A10 256.52 58 33 214 294
243 Rider 240 MAAC 257.39 56 74 204 289
244 St. Bonaventure 245 A10 261.57 51 92 212 294
245 Eastern Kentucky 235 OVC 262.04 54 45 206 294
246 Fairfield 258 MAAC 262.34 50 47 204 289
247 Chicago State 287 MidCon 263.42 59 54 209 294
248 Eastern Illinois 256 OVC 267.95 58 82 214 294
249 Holy Cross 244 Pat 269.00 44 68 216 294
250 Pennsylvania 271 Ivy 271.63 40 40 220 294
251 LeMoyne 178 MAAC 273.45 55 48 220 289
252 Texas Southern 190 SWAC 273.72 47 4 224 294
253 North Carolina A&T 225 MEAC 276.96 56 17 218 294
254 Delaware State 236 MEAC 278.16 58 17 217 288
255 Iona 277 MAAC 278.73 59 47 212 294
256 Temple 232 A10 278.87 55 16 228 294
257 Maine 94 AE 279.02 60 2 219 294
258 Bucknell 228 Pat 279.31 45 45 220 294
259 Coppin State 278 MEAC 280.84 56 33 225 288
260 Norfolk State 279 MEAC 285.04 52 33 225 294
261 Niagara 212 MAAC 286.75 59 124 218 294
262 IUPU-Fort Wayne 202 Ind 287.69 58 54 231 294
263 Rhode Island 92 A10 288.73 56 66 227 294
264 Maryland-Eastern Shore 288 MEAC 291.17 52 33 229 280
265 Binghamton 217 AE 293.23 53 94 226 294
266 Utah Valley State 273 Ind 294.41 56 7 238 294
267 Western Illinois 249 MidCon 294.44 64 12 247 290
268 Manhattan 204 MAAC 295.62 53 3 240 289
269 Navy 262 Pat 301.54 52 70 233 288
270 Southern 146 SWAC 303.31 42 16 224 294
271 Centenary 209 MidCon 304.75 56 16 250 287
272 Valparaiso 263 MidCon 307.24 59 54 249 294
273 Monmouth 201 NE 307.80 54 40 241 294
274 St. Francis 282 NE 308.12 49 47 233 289
275 Sacred Heart 241 NE 308.53 55 68 239 294
276 Lehigh 199 Pat 308.98 55 59 236 294
277 Florida A&M 265 MEAC 310.91 54 5 236 294
278 St. Peter's 289 MAAC 311.22 58 47 240 294
279 Army 93 Pat 311.75 55 63 242 289
280 Fairleigh Dickinson 270 NE 312.14 56 47 239 289
281 Southern Utah 250 MidCon 313.11 56 30 253 287
282 Long Island 280 NE 313.56 54 47 239 289
283 Lafayette 242 Pat 315.18 51 74 239 294
284 Mount St. Mary's 255 NE 317.16 51 33 239 288
285 Canisius 283 MAAC 318.30 57 126 240 294
286 Central Connecticut State 233 NE 320.04 49 92 241 282
287 Prairie View A&M 224 SWAC 328.72 53 67 260 294
288 Mississippi Valley State 261 SWAC 333.87 55 6 267 294
289 Savannah State 230 Ind 348.51 51 13 276 294
290 Alcorn State 267 SWAC 365.74 47 38 261 294
291 Jackson State 260 SWAC 369.50 40 3 267 294
292 Alabama A&M 290 SWAC 382.57 49 65 267 294
293 Alabama State 284 SWAC 385.92 50 61 267 294

Click Here to view this Link.
For more in-depth analysis of college baseball, Subscribe to SEBaseball.com.