2006 Non-Conference Schedule Strength
"Intended" Schedule Strength
One of the things to look forward to every year is Boyd Nation's Breadcrumbs Back To Omaha column on "Intended Schedule Strength". In that annual column, Boyd characterizes each team's non-conference opponents by last season's ISR values. This is a perfectly good way to do it, especially from the fans' point of view, since it is the best characterization of how good the games are likely to be.
Advertisement
There are other ways to look at an "intended" SOS, though. An average can be affected by extreme values - a team that has 5 games against the top 10 and 20 against the bottom 100 will have a poorer average than a team that doesn't play anyone in the top 50 but also doesn't play anyone outside of the top 100. There are good arguments for each variety to be called a "good schedule".
SEBaseball.com's Intended SOS is a little different, so we'll spend some time explaining it.
First, we looked for a way to use ordinal rankings instead of a rating's values, because that's what most fans (and coaches) look at. This is a little tricky, because those don't correspond as accurately as values - the difference between #1 and #10 is usually a lot higher than the difference between #141 and #150, for instance.
Second, rather than average we wanted a measure of the "strength and depth" of the schedule - something not unduly influenced by a few very high or very low rankings. The usual choice for a strength metric is the median opponents' rank, but that makes no distinction regarding the breadth - a team with all opponents ranked worse than its median opponents' rank in the bottom 50 really doesn't have the same SOS as a team with all such opponents in the top 150.
What we came up with could be called a "weighted median", and is a measure of how "top-heavy" or "bottom-heavy" a schedule is. It's value is like an ordinal rank, but can be less than one (or even negative) or greater than the total number of teams, depending upon how heavily a schedule "leans" toward the low or high end of the rankings.
How the Weighted Median Is Calculated
We'll use a football schedule as an example, because 11 opponents are easier to illustrate than 25.
The SOS measurement used here takes those factors into account by relating the median opponent's strength to the median of the field weighted by how "top-heavy" or "bottom-heavy" the schedule is. There are two parts to the straightforward calculation:
Sum the total differences of opponents' ranks from the median of the field. For instance, if there are 119 teams the median is 60, and for a typical schedule we might have:
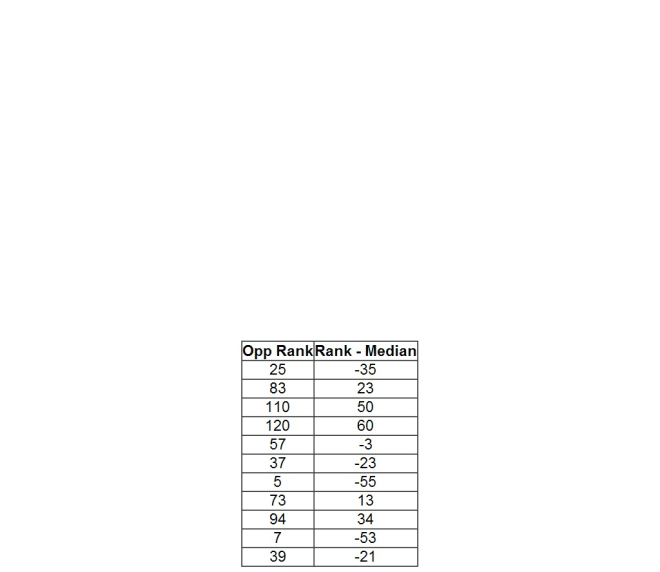
The sum of the differences is -10 and the average is -0.9. (We chose games against opponents from the top half of the field to contribute the negative amount because lower numbers are better in ordinal rankings.)
The average difference from the field's median isn't useful to compare different teams' schedules - all teams could have a zero value because 10 and 109 is the same as 50 and 69. To come up with a schedule rating that can be compared, we just add the average deviation from the field median to the median power rating for this particular schedule. In this case we get:

and then order the schedules by increasing value of schedule rating. In this case, the schedule came out 58th in the list, very nearly the overall median.
2006 Intended SOS
A third reason we chose to use ordinal ranks is that you can insert any rating system. There is no really good way to compare an ISR difference to an RPI difference, because they're on different scales. But you can compare an ISR rank to an RPI rank if you are careful. For our report we chose RPI, because that is presumably what the coaches needed to look at when they "intentionally" came up with their schedules, because that's what the committee uses.
Before we get to the numbers, a few things stand out.
Western teams (historically shafted by the RPI) feature prominently in the non-conference SOS (by RPI). Whether it's them or their opponents, somebody's working on getting us more inter-regional matchups, and that is Good.
This may be a coincidence due to geography, but the Southland Conference consists of the largest collection of teams that have chosen really tough schedules (by RPI standards) out there.
Stephen F. Austin didn't just step into the pool, for their first year back in Division 1, they dove headfirst into the deep end. Newcomers Kennessaw State and North Florida also have top-100 schedules.
Seeing Florida and Alabama in the top 50 is worth the raising of an eyebrow.
Note, besides the teams who weren't ranked last year (Kennessaw, North Florida, and Stephen F. Austin, "TBA" is also ranked 294th, so don't pay too much attention to that value in the "Worst" column. Also, don't be too concerned with Harvard, note that they only have eight games against non-conference opponents (and not all schedules are "final", yet).
Source: Schedules compiled at http://www.ncaa-baseball.com
Team
valign=bottom align=center> 2005
RPI Conf
ISS Cnt
valign=bottom align=center> Best Median
valign=bottom align=center> Worst
1 Long Beach State 29 BigW
-45.97 29 1 35
184
2 UCLA 184 P10 -45.63
32 2 32 174
3 Rice 18 CUSA
align=right>-40.97 32 1 42
align=center>294
4 Cal State Fullerton 10 BigW
align=right>-35.19 26 15 37
align=center>184
5 Harvard 98 Ivy
align=right>-28.25 8 5 41
align=center>244
6 Southern California 15 P10
align=right>-23.31 32 10 55
align=center>174
7 Texas State 95 SLC
-19.52 27 1 42
224
8 Arizona State 11 P10
align=right>-1.28 29 1 60
align=center>221
9 Nevada-Las Vegas 109 MW
-0.09 34 1 64
align=center>196
10 San Diego 137 WCC
align=right>1.00 35 1 62
align=center>190
11 Southeastern Louisiana 138
SLC 1.15 26 2
align=center>57 229
12 Louisiana-Monroe 172 SLC
align=right>4.46 26 16 49
align=center>272
13 Cal State Northridge 186
BigW 4.77 26 11 62
210
14 New Mexico 207 MW
align=right>4.85 33 7 58
align=center>273
15 Florida 5 SEC
align=right>8.69 26 8 63
align=center>294
16 Oral Roberts 72 MidCon
align=right>11.00 32 3 56
align=center>294
17 Stetson 57 ASUN
align=right>13.35 26 5 63
align=center>215
18 Charleston Southern 110 BigS
align=right>14.00 32 12 71
align=center>208
19 College of Charleston 13
SoCon 16.71 28 9 70
230
20 Houston 60 CUSA
align=right>18.03 32 1 67
align=center>294
21 Bethune-Cookman 215 MEAC
20.83 36 5 72
align=center>294
22 South Alabama 61 SBC
align=right>20.97 32 3 57
align=center>284
23 Texas A&M 42 B12
22.93 29 5 82
align=center>253
24 Georgia 31 SEC 24.56
25 6 79 294
25 Clemson 9 ACC
align=right>24.69 26 13 81
align=center>213
26 Texas Christian 34 MW
align=right>24.74 34 3 84
align=center>294
27 Texas-Arlington 112 SLC
28.03 31 1 72
align=center>294
28 Florida Atlantic 41 ASUN
align=right>28.28 25 19 87
align=center>251
29 Georgia Tech 6 ACC
28.35 26 19 71
294
30 Texas 1 B12 32.76
29 3 95 176
31 Coastal Carolina 21 BigS
37.31 35 6 83
align=center>294
32 Wake Forest 73 ACC
align=right>37.68 25 5 81
align=center>246
33 Stephen F. Austin 294 SLC
37.81 26 3 84
205
34 Baylor 4 B12 38.07
29 11 84 294
35 Alabama 23 SEC
align=right>38.50 26 12 76
align=center>261
36 Nicholls State 194 SLC
align=right>38.60 25 2 61
align=center>294
37 San Diego State 174 MW
40.79 38 10 102
184
38 Auburn 22 SEC 42.31
26 11 81 248
39 South Florida 63 BigE
43.17 29 5 82
align=center>294
40 Loyola Marymount 105 WCC
align=right>44.00 35 10 96
align=center>186
41 Birmingham-Southern 76
BigS 44.09 32 22 85
290
42 Wright State 181 Hor
align=right>45.04 26 8 78
align=center>286
43 UC Riverside 96 BigW
46.21 28 15 105
184
44 Southern Mississippi 38 CUSA
align=right>50.47 32 2 84
align=center>267
45 California 64 P10
50.57 28 4 101
238
46 Pepperdine 32 WCC
align=right>51.80 35 3 101
align=center>210
47 Oklahoma 36 B12
align=right>52.66 29 11 95
align=center>249
48 Kennesaw State 294 ASUN
align=right>55.41 22 6 71
align=center>294
49 McNeese State 162 SLC
55.68 25 3 84
align=center>224
50 Samford 243 OVC
align=right>56.07 29 2 85
align=center>294
51 Texas-San Antonio 136 SLC
58.52 29 1 93
294
52 Northwestern 161 B10
align=right>60.20 25 32 97
align=center>294
53 Elon 81 SoCon
align=right>62.03 29 9 111
align=center>195
54 Florida International 66 SBC
align=right>62.97 32 8 92
align=center>265
55 Minnesota 107 B10
63.71 24 12 88
294
56 Kent State 111 MAC
align=right>63.79 28 23 83
align=center>294
57 North Carolina 14 ACC
64.77 26 21 99
248
58 George Mason 70 CAA
align=right>65.63 24 13 91
align=center>278
59 Louisiana Tech 203 WAC
66.47 32 4 90
align=center>281
60 Illinois State 145 MVC
align=right>66.50 32 12 89
align=center>294
61 UC Irvine 55 BigW
66.74 31 15 102
238
62 Louisville 69 BigE
align=right>68.07 30 8 86
align=center>246
63 St. Louis 214 A10
68.87 31 2 88
align=center>275
64 Purdue 80 B10 70.38
24 14 89 287
65 Arizona 30 P10
align=right>72.62 29 10 105
align=center>250
66 East Carolina 53 CUSA
align=right>76.17 30 10 120
align=center>226
67 Fresno State 167 WAC
81.13 32 32 84
294
68 North Carolina-Greensboro 79 SoCon
81.33 30 5 111
253
69 North Florida 294 ASUN
81.69 26 5 115
265
70 Winthrop 28 BigS
align=right>83.23 35 8 111
align=center>246
71 Grambling State 272 SWAC
83.57 14 44 104
294
72 Wichita State 35 MVC
align=right>84.30 40 12 100
align=center>294
73 Nebraska 12 B12
align=right>84.69 29 17 110
align=center>264
74 Campbell 127 ASUN
align=right>87.92 26 14 110
align=center>254
75 UC Santa Barbara 101 BigW
88.00 28 15 105
294
76 Missouri State 88 MVC
align=right>88.74 31 20 107
align=center>253
77 The Citadel 141 SoCon
88.82 28 12 110
268
78 Jacksonville 113 ASUN
align=right>89.38 24 27 115
align=center>265
79 Texas-Pan American 176
Ind 90.41 41 1 119
294
80 Stanford 37 P10
align=right>90.77 26 1 129
align=center>238
81 Dallas Baptist 84 Ind
93.40 50 1 112
294
82 George Washington 99 A10
align=right>93.41 29 14 116
align=center>257
83 Illinois 82 B10
align=right>93.54 24 42 115
align=center>294
84 Florida State 27 ACC
align=right>94.81 27 5 113
align=center>294
85 Ball State 78 MAC
95.80 30 26 116
268
86 North Carolina-Asheville 237 BigS
96.19 36 19 118
276
87 Louisiana-Lafayette 43
SBC 98.79 29 42 121
203
88 Eastern Michigan 196 MAC
align=right>99.56 27 19 109
align=center>294
89 Furman 108 SoCon
99.93 28 9 122
278
90 Tulane 3 CUSA 100.56
32 1 122 294
91 Mercer 123 ASUN
align=right>100.69 26 5 118
align=center>265
92 Brown 151 Ivy 101.67
24 26 124 294
93 Oakland 266 MidCon
102.79 33 19 111
294
94 Texas Tech 49 B12
align=right>102.83 29 3 127
align=center>237
95 Pacific 117 BigW
103.94 32 4 129
238
96 Hawaii 102 WAC
align=right>105.84 32 15 105
align=center>294
97 Virginia Commonwealth 97
CAA 106.67 27 6 120
279
98 Portland 193 WCC
align=right>106.77 31 7 130
align=center>285
99 Xavier 246 A10
align=right>108.45 33 28 133
align=center>268
100 San Jose State 159 WAC
align=right>108.91 33 37 125
align=center>294
101 North Carolina-Wilmington 51
CAA 111.22 27 17
align=center>120 288
102 Michigan 50 B10
align=right>111.54 24 4 115
align=center>266
103 Alabama-Birmingham 90
CUSA 112.16 32 23 123
294
104 Cal State Sacramento 238 WAC
align=right>114.48 33 7 129
align=center>285
105 Georgia Southern 48
SoCon 115.00 30 6 118
294
106 Lamar 67 SLC 115.31
26 18 140 277
107 Belmont 135 ASUN
115.60 25 19 114
294
108 Notre Dame 54 BigE
align=right>115.69 29 12 121
align=center>294
109 Texas Southern 190 SWAC
117.35 20 4 119
294
110 Georgia State 118 CAA
align=right>117.38 26 6 123
align=center>274
111 Columbia 251 Ivy
119.29 21 41 124
280
112 Santa Clara 129 WCC
align=right>119.60 35 37 130
align=center>294
113 Maryland 139 ACC
121.23 26 28 116
288
114 Cal Poly 58 BigW
align=right>122.31 26 7 137
align=center>210
115 Memphis 222 CUSA
123.13 32 2 140
275
116 North Dakota State 285 Ind
align=right>123.30 44 35 121
align=center>294
117 Iowa 121 B10
align=right>124.68 25 12 143
align=center>285
118 Nevada 134 WAC
align=right>125.79 33 7 130
align=center>273
119 Siena 152 MAAC
align=right>126.32 31 19 133
align=center>252
120 Gardner-Webb 147 ASUN
align=right>126.50 26 9 124
align=center>248
121 Northwestern State 44
SLC 126.52 25 3 121
294
122 Mississippi State 24 SEC
align=right>127.00 26 30 140
align=center>275
123 Murray State 191 OVC
127.75 28 2 140
222
124 Vanderbilt 26 SEC
align=right>128.23 26 15 137
align=center>274
125 Northern Colorado 180
Ind 128.59 44 12 125
294
126 Virginia Tech 120 ACC
align=right>128.74 27 51 127
align=center>254
127 LaSalle 227 A10
129.19 27 30 128
271
128 Jacksonville State 150 OVC
align=right>129.34 29 24 138
align=center>294
129 Tennessee Tech 274 OVC
130.97 31 16 133
287
130 South Carolina 25 SEC
align=right>131.85 26 9 141
align=center>218
131 Kansas 100 B12
align=right>133.66 35 9 137
align=center>294
132 High Point 179 BigS
align=right>134.31 32 13 150
align=center>225
133 Dartmouth 210 Ivy
134.78 23 32 144
276
134 Penn State 122 B10
align=right>135.48 27 3 128
align=center>294
135 Quinnipiac 166 NE
138.35 26 25 151
276
136 Towson 116 CAA
align=right>143.77 26 14 139
align=center>278
137 Evansville 86 MVC
144.85 33 28 143
294
138 East Tennessee State 133 ASUN
align=right>144.91 32 6 142
align=center>274
139 Northern Illinois 221
MAC 144.93 30 11 145
287
140 UC Davis 130 BigW
align=right>145.27 33 7 137
align=center>285
141 Massachusetts 252 A10
146.73 22 59 131
294
142 Austin Peay State 143 OVC
align=right>147.47 32 26 142
align=center>294
143 Mississippi Valley State 261
SWAC 147.71 28 6
align=center>140 294
144 Marist 132 MAAC
align=right>149.83 23 24 151
align=center>279
145 Troy 65 SBC
align=right>151.10 31 22 150
align=center>294
146 Louisiana State 16 SEC
align=right>151.92 26 3 146
align=center>294
147 Oregon State 7 P10
152.46 28 32 144
273
148 Southeast Missouri State 198 OVC
154.28 29 39 148
264
149 Princeton 234 Ivy
154.95 21 47 141
294
150 Ohio State 59 B10
align=right>155.00 24 5 149
align=center>266
151 Tennessee-Martin 275 OVC
155.31 29 24 140
294
152 Stony Brook 219 AE
align=right>155.61 31 28 163
align=center>282
153 Wagner 239 NE
align=right>155.81 27 28 160
align=center>289
154 Washington 62 P10
align=right>156.66 38 20 144
align=center>294
155 Cleveland State 259 Hor
157.56 27 54 158
231
156 Miami, Florida 8 ACC
align=right>157.60 25 5 170
align=center>294
157 Middle Tennessee State 85
SBC 157.69 32 26
align=center>150 275
158 Illinois-Chicago 149 Hor
align=right>159.25 24 2 161
align=center>287
159 Michigan State 157 B10
160.00 24 8 158
294
160 Western Carolina 71 SoCon
align=right>160.79 29 6 147
align=center>294
161 Youngstown State 142 Hor
164.72 32 52 143
294
162 Richmond 211 A10
align=right>165.32 31 12 165
align=center>234
163 Butler 268 Hor
align=right>166.88 24 26 148
align=center>294
164 Appalachian State 248 SoCon
align=right>166.97 30 14 147
align=center>283
165 St. John's 47 BigE
168.68 28 12 163
289
166 Hofstra 188 CAA
align=right>169.15 27 13 160
align=center>282
167 Sam Houston State 119
SLC 169.19 27 18 176
224
168 Vermont 131 AE
align=right>170.58 31 57 163
align=center>294
169 Lipscomb 168 ASUN
171.37 27 23 143
287
170 New Mexico State 156 WAC
align=right>174.13 32 49 153
align=center>294
171 Liberty 91 BigS
174.81 32 33 155
276
172 Oklahoma State 52 B12
align=right>176.31 29 20 174
align=center>281
173 Albany 226 AE
align=right>176.73 33 47 165
align=center>282
174 Western Michigan 115 MAC
align=right>176.86 28 50 157
align=center>294
175 Arkansas 20 SEC
177.12 26 34 176
294
176 Missouri 46 B12
align=right>177.63 30 5 172
align=center>294
177 Wofford 213 SoCon
178.10 29 9 166
254
178 North Carolina-Charlotte 126 A10
181.31 29 13 170
283
179 Pittsburgh 83 BigE
181.41 29 21 168
294
180 North Carolina State 17 ACC
align=right>182.22 27 12 179
align=center>254
181 San Francisco 56 WCC
182.43 35 7 167
273
182 Kentucky 75 SEC
align=right>183.50 26 67 161
align=center>285
183 LeMoyne 178 MAAC
185.43 28 48 158
245
184 Centenary 209 MidCon
align=right>185.69 32 16 153
align=center>285
185 Hawaii-Hilo 247 Ind
185.75 51 35 159
294
186 Western Illinois 249 MidCon
align=right>186.40 40 12 157
align=center>290
187 Wisconsin-Milwaukee 183
Hor 186.65 26 46 169
287
188 Boston College 68 ACC
align=right>187.29 17 83 164
align=center>276
189 Virginia 33 ACC
188.96 27 13 165
288
190 Brigham Young 125 MW
align=right>193.09 33 7 169
align=center>273
191 Rutgers 74 BigE
194.29 28 6 185
289
192 Texas A&M-Corpus Christi 104 Ind
195.11 36 11 174
294
193 Hartford 276 AE
195.84 31 68 170
252
194 Miami, Ohio 45 MAC
align=right>197.55 29 59 170
align=center>294
195 Mississippi 2 SEC
199.44 25 38 184
243
196 Western Kentucky 197 SBC
align=right>199.74 31 26 183
align=center>268
197 New Orleans 177 SBC
200.03 32 3 186
277
198 Cornell 220 Ivy
align=right>201.41 22 59 178
align=center>256
199 Georgetown 171 BigE
202.23 30 56 169
278
200 Duquesne 216 A10
align=right>202.38 29 25 171
align=center>294
201 Arkansas State 140 SBC
202.38 34 2 191
281
202 Central Michigan 77 MAC
align=right>203.30 30 50 164
align=center>294
203 Duke 195 ACC
align=right>203.69 29 28 187
align=center>288
204 Fordham 160 A10
align=right>204.12 33 8 187
align=center>282
205 Marshall 200 CUSA
205.19 32 45 182
259
206 Southern Illinois 87 MVC
align=right>205.33 33 41 191
align=center>285
207 Utah 253 MW
align=right>206.82 33 42 169
align=center>273
208 Connecticut 106 BigE
align=right>207.75 32 41 177
align=center>294
209 Coppin State 278 MEAC
207.87 38 33 175
270
210 St. Joseph's 269 A10
align=right>210.26 31 33 185
align=center>294
211 Central Florida 40 CUSA
211.44 32 5 201
294
212 Norfolk State 279 MEAC
align=right>211.68 34 33 175
align=center>294
213 North Carolina A&T 225
MEAC 212.29 38 17 179
294
214 Davidson 124 SoCon
align=right>214.19 27 14 192
align=center>251
215 Radford 218 BigS
216.57 30 25 189
279
216 Dayton 154 A10
align=right>217.93 29 33 181
align=center>268
217 Akron 206 MAC
align=right>218.20 30 19 191
align=center>294
218 South Dakota State 264 Ind
align=right>218.92 39 12 198
align=center>294
219 Southern 146 SWAC
219.21 14 16 177
294
220 New York Tech 163 Ind
align=right>219.32 57 47 187
align=center>294
221 Tennessee 19 SEC
221.11 27 6 196
274
222 Arkansas-Pine Bluff 281 SWAC
align=right>221.73 11 52 203
align=center>209
223 Northern Iowa 153 MVC
223.06 33 12 192
294
224 St. Mary's 169 WCC
align=right>224.47 34 7 183
align=center>294
225 Morehead State 223 OVC
227.29 31 19 197
294
226 Ohio 158 MAC 228.24
29 83 178 294
227 Seton Hall 187 BigE
229.44 25 14 195
294
228 Bowling Green State 103 MAC
align=right>229.97 30 50 191
align=center>294
229 Indiana State 148 MVC
230.06 33 36 191
286
230 Arkansas-Little Rock 205 SBC
align=right>230.67 30 39 191
align=center>294
231 Prairie View A&M 224
SWAC 233.31 26 67 176
294
232 Fairfield 258 MAAC
align=right>234.83 23 47 192
align=center>282
233 Maryland-Baltimore County 257
AE 235.42 33 93
align=center>195 283
234 Rider 240 MAAC
align=right>235.62 29 74 201
align=center>280
235 Northeastern 164 CAA
236.91 23 6 202
294
236 Delaware State 236 MEAC
align=right>237.58 40 17 199
align=center>270
237 James Madison 182 CAA
238.00 28 9 211
258
238 William and Mary 155 CAA
align=right>239.58 24 9 211
align=center>279
239 Maryland-Eastern Shore 288
MEAC 239.74 34 33
align=center>199 280
240 Creighton 39 MVC
align=right>240.55 33 12 205
align=center>286
241 Eastern Kentucky 235 OVC
242.07 27 45 200
294
242 Cincinnati 173 BigE
align=right>242.93 29 5 212
align=center>266
243 Pennsylvania 271 Ivy
243.15 20 40 199
294
244 Eastern Illinois 256 OVC
align=right>244.00 31 82 202
align=center>294
245 Chicago State 287 MidCon
244.94 35 54 202
294
246 Toledo 231 MAC
align=right>245.11 28 50 202
align=center>294
247 Old Dominion 189 CAA
247.31 26 33 211
279
248 Valparaiso 263 MidCon
align=right>248.63 35 54 202
align=center>294
249 Sacred Heart 241 NE
249.77 31 68 199
294
250 Holy Cross 244 Pat
align=right>251.00 24 68 202
align=center>294
251 Yale 192 Ivy
align=right>251.35 26 25 211
align=center>276
252 Maine 94 AE 251.69
36 2 201 294
253 Gonzaga 144 WCC
252.44 34 7 208
294
254 Longwood 254 Ind
align=right>256.16 58 17 213
align=center>289
255 Virginia Military 165
BigS 257.53 38 22 212
288
256 Jackson State 260 SWAC
align=right>263.33 9 3 209
align=center>294
257 IUPU-Fort Wayne 202 Ind
266.40 55 54 213
294
258 Manhattan 204 MAAC
align=right>271.85 26 3 239
align=center>282
259 Indiana 170 B10
274.39 31 8 235
294
260 Bucknell 228 Pat
align=right>276.96 25 45 219
align=center>294
261 Niagara 212 MAAC
279.06 32 124 217
294
262 St. Bonaventure 245 A10
align=right>279.21 24 94 212
align=center>294
263 Buffalo 229 MAC
279.84 31 38 212
294
264 Monmouth 201 NE
align=right>281.23 30 40 240
align=center>294
265 Delaware 185 CAA
284.15 26 74 227
294
266 St. Francis 282 NE
align=right>288.16 25 47 226
align=center>289
267 Florida A&M 265 MEAC
289.11 36 5 230
294
268 West Virginia 175 BigE
align=right>289.45 33 17 228
align=center>289
269 Central Connecticut State 233
NE 290.96 25 92
align=center>227 277
270 Long Island 280 NE
align=right>293.10 30 47 230
align=center>289
271 Utah Valley State 273
Ind 295.74 53 7 238
294
272 Air Force 286 MW
align=right>295.96 27 39 230
align=center>294
273 Fairleigh Dickinson 270
NE 296.41 32 47 236
289
274 Kansas State 89 B12
align=right>296.52 29 35 246
align=center>294
275 Mount St. Mary's 255 NE
296.85 27 33 231
288
276 Iona 277 MAAC
align=right>297.44 32 47 233
align=center>294
277 Army 93 Pat
align=right>298.31 35 63 239
align=center>289
278 Temple 232 A10
align=right>299.00 27 16 242
align=center>294
279 Villanova 128 BigE
299.20 30 1 232
289
280 Rhode Island 92 A10
align=right>299.86 29 66 233
align=center>294
281 Southern Utah 250 MidCon
300.19 32 30 253
286
282 Bradley 114 MVC
align=right>306.11 35 76 235
align=center>294
283 Navy 262 Pat
align=right>311.50 32 70 234
align=center>288
284 Binghamton 217 AE
align=right>311.59 29 152 233
align=center>294
285 Lehigh 199 Pat
align=right>312.51 35 59 236
align=center>294
286 St. Peter's 289 MAAC
align=right>315.94 31 47 242
align=center>294
287 Alcorn State 267 SWAC
318.15 13 38 229
294
288 Washington State 208 P10
align=right>318.81 37 46 247
align=center>294
289 Canisius 283 MAAC
331.87 30 126 245
294
290 Savannah State 230 Ind
align=right>344.42 48 13 276
align=center>294
291 Lafayette 242 Pat
344.77 31 74 257
294
292 Alabama A&M 290 SWAC
align=right>404.36 25 65 294
align=center>294
293 Alabama State 284 SWAC
408.83 24 61 294
294

Click Here to view this Link.
For more in-depth analysis of college baseball, Subscribe to SEBaseball.com.